Official 2018-19 Winter Forecast
Meteorological winter is under a month away now, and as usual, there is much talk of what the upcoming winter will be like. Will your region see colder and wetter conditions? Milder and drier? I'll be covering that, along with my forecast logic in my official 2018-19 winter forecast.

So here it is! My official winter outlook! I'm expecting below average temperatures to dominate the eastern 2/3rds of the country, and have milder temperatures in the west, with the mildest in the Pacific Northwest. Above average precipitation looks to dominate the east coast and much of the south, and drier conditions look to take hold in the west and midwest. The storm track over south Texas and the Southeast looks to be very active, which should lead to above average precipitation there.
Now, I'll be going in depth on my reasoning for this forecast. There are many, many factors that go into a winter forecast, each having a different type and amount of impact. I'll be discussing each factor in detail, and will talk about how big of a role it will play this winter.


The ENSO is a region over the Equatorial Pacific Ocean, and is usually the biggest factor that plays into our winter. The ENSO is likely to be in a weak-moderate El Niño, meaning sea surface temperatures (SST's) in the ENSO region will likely be 0.5-1.5ñC above average. So how does water thousands of miles away affect the US?

Here's what the average weak to moderate El Niño looks like. This year, however, may not be an average El Niño. Usually, SST's in El Niños are warmest off South America, however, the El Niño we may experience this year could have warmest SST's in the Central Equatorial Pacific. This changes the effects of the El Niño, which I took into account in my forecast.


Now, I'm going to cover SST's in the Atlantic, which can have a big impact on coastal storms. SST's off the East Coast are below average currently, but they will likely go back to above average, which will provide more fuel than usual for coastal storms, and allow them to intensify more. SST's around Greenland and Iceland are below average, which usually favors a +NAO (I talk about the NAO in the next paragraph). These two regions of SST's stand out the most this year.

Short range teleconnections are very hard to predict in the long term, because they can switch from positive to negative every few weeks. However, you can still predict whether they're positive or negative phase dominates throughout the winter. I'll talk about the PNA first. The PNA is a geopotential height anomaly in the northwest US. A positive phase leads to colder temperatures in the east and warmer in the west, and a negative phase leads to the opposite. The PNA will likely be positive more than negative this year, because it's largely influenced by the PDO phase.
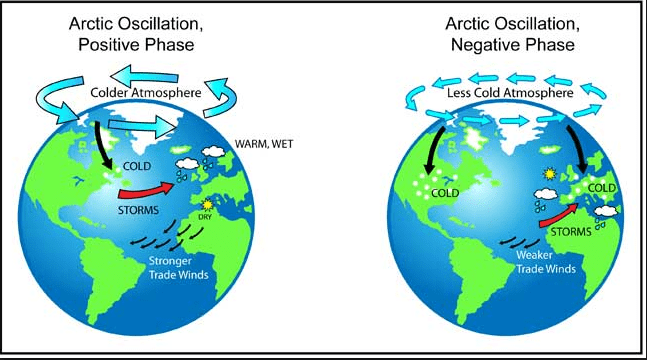
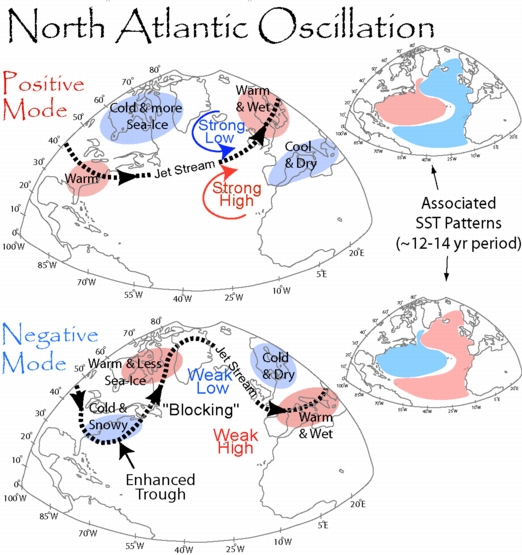
 The AO is a geopotential height anomaly over the Arctic. When the AO is positive (below average heights/pressure), the chance of Arctic outbreaks decrease, and the chance increases when it's negative. The NAO is a height anomaly near Iceland. A positive NAO leads to an unfavorable track for coastal storms to produce a lot of snow, and a negative NAO leads to the opposite. I'm expecting the AO to be predominantly negative, largely due to the solar minimum. I'm expecting the NAO to be predominantly positive, because SST's around Iceland have been below average, though there are hints that the NAO could be very negative in February.
Keep in mind, the AO, NAO, and PNA will all switch between positive and negative throughout winter, so don't expect them to be in one phase the entire time. My forecast for those teleconnections just predicts whether the positive or negative phase will dominate.
(I highly recommend clicking this link for more information on these teleconnections)

There are two other factors I was considering to take into account; long range models and Siberian snow cover. Long range models are very inaccurate, and the only thing they are consistent with are SST anomalies, so I only use them to help me with teleconnections. Siberian snowfall just hasn't shown much consistency for impacting winter in the US, so I don't like to use it.


So, that was my official winter outlook for 2018-19, and the methodology behind it. The teleconnections never all go into the phase that means more snow or less snow, so we have to look at them and see if the signal for a cold winter outweighs the signal for a mild one, and vice versa. Thank you for sticking around and reading this outlook to the end, I hope it helped you understand what we may be looking at this winter. Have a great day!
Twitter: @NikeelTri
MAP CREDITS (only for maps without watermarks):
QBO map: https://blog.weatherops.com/hubfs/blog-files/QBOandWinterTemps.png?t=1531354170876
AO map: https://www.bestweatherinc.com/wp-content/uploads/2016/12/Screen-Shot-2016-12-27-at-4.11.07-AM-e1482829968207.png
NAO map: http://www-personal.umich.edu/~auraell/precipitation/images/nao%20diagram.jpg

